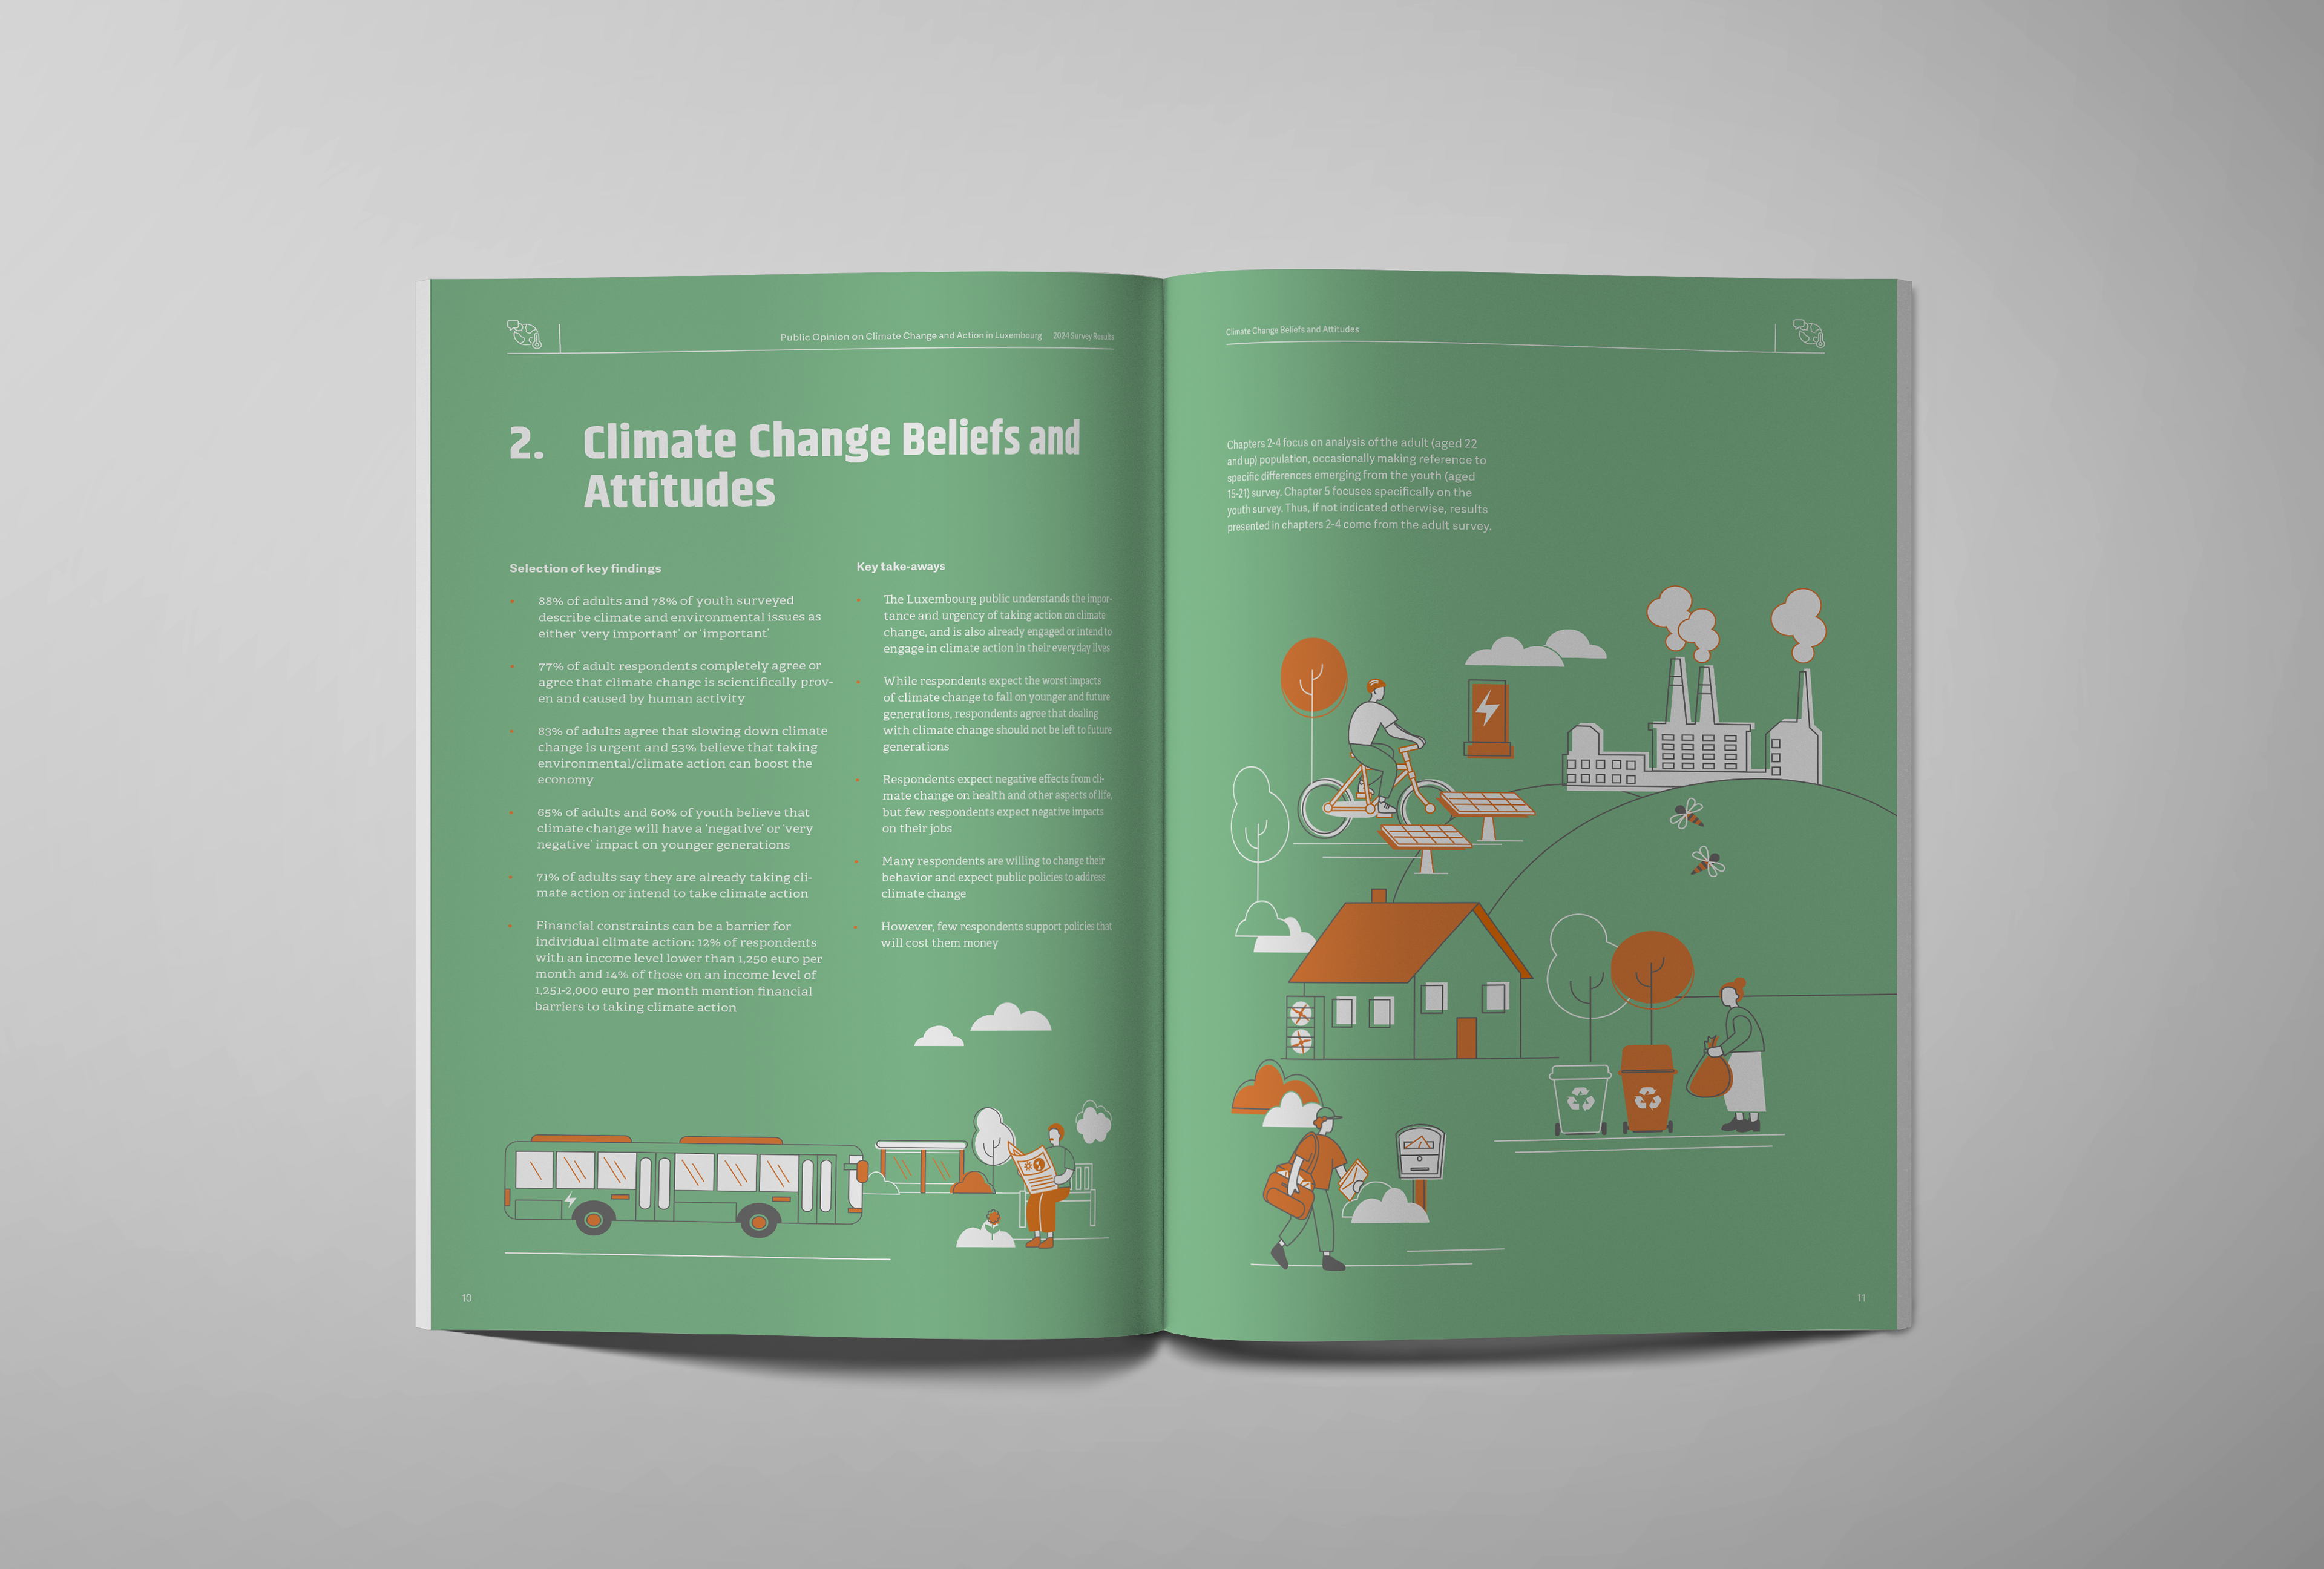
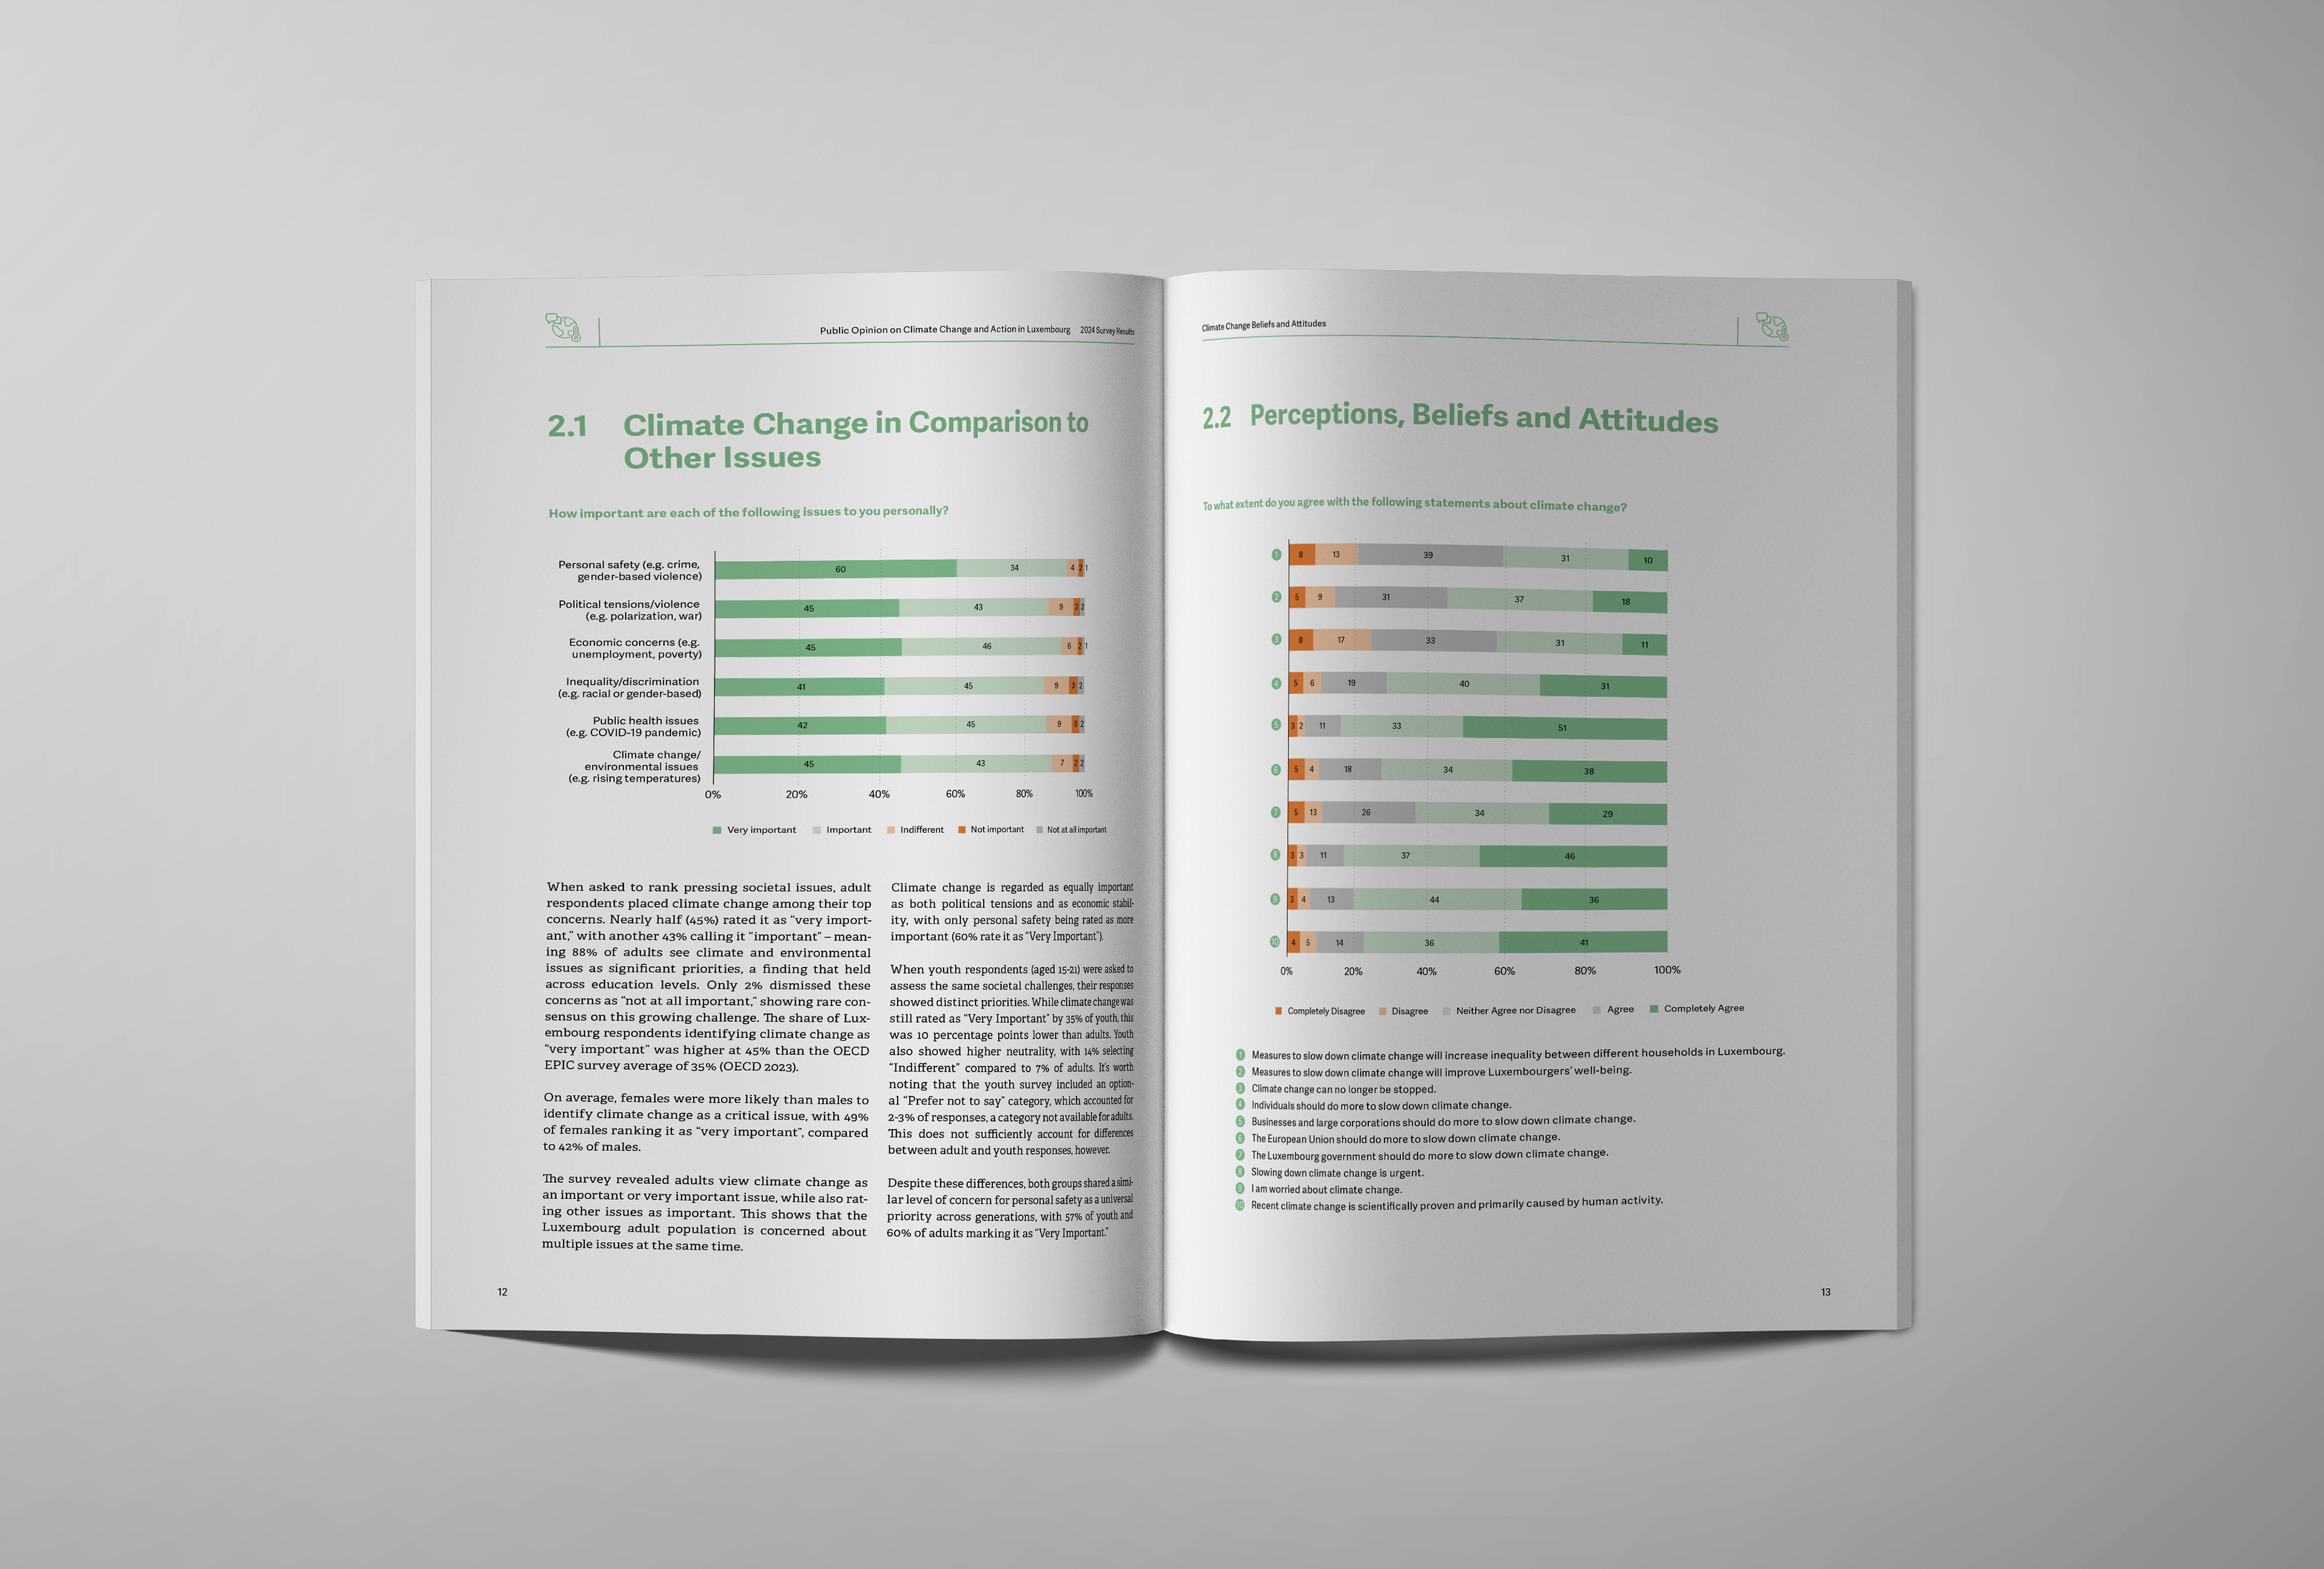
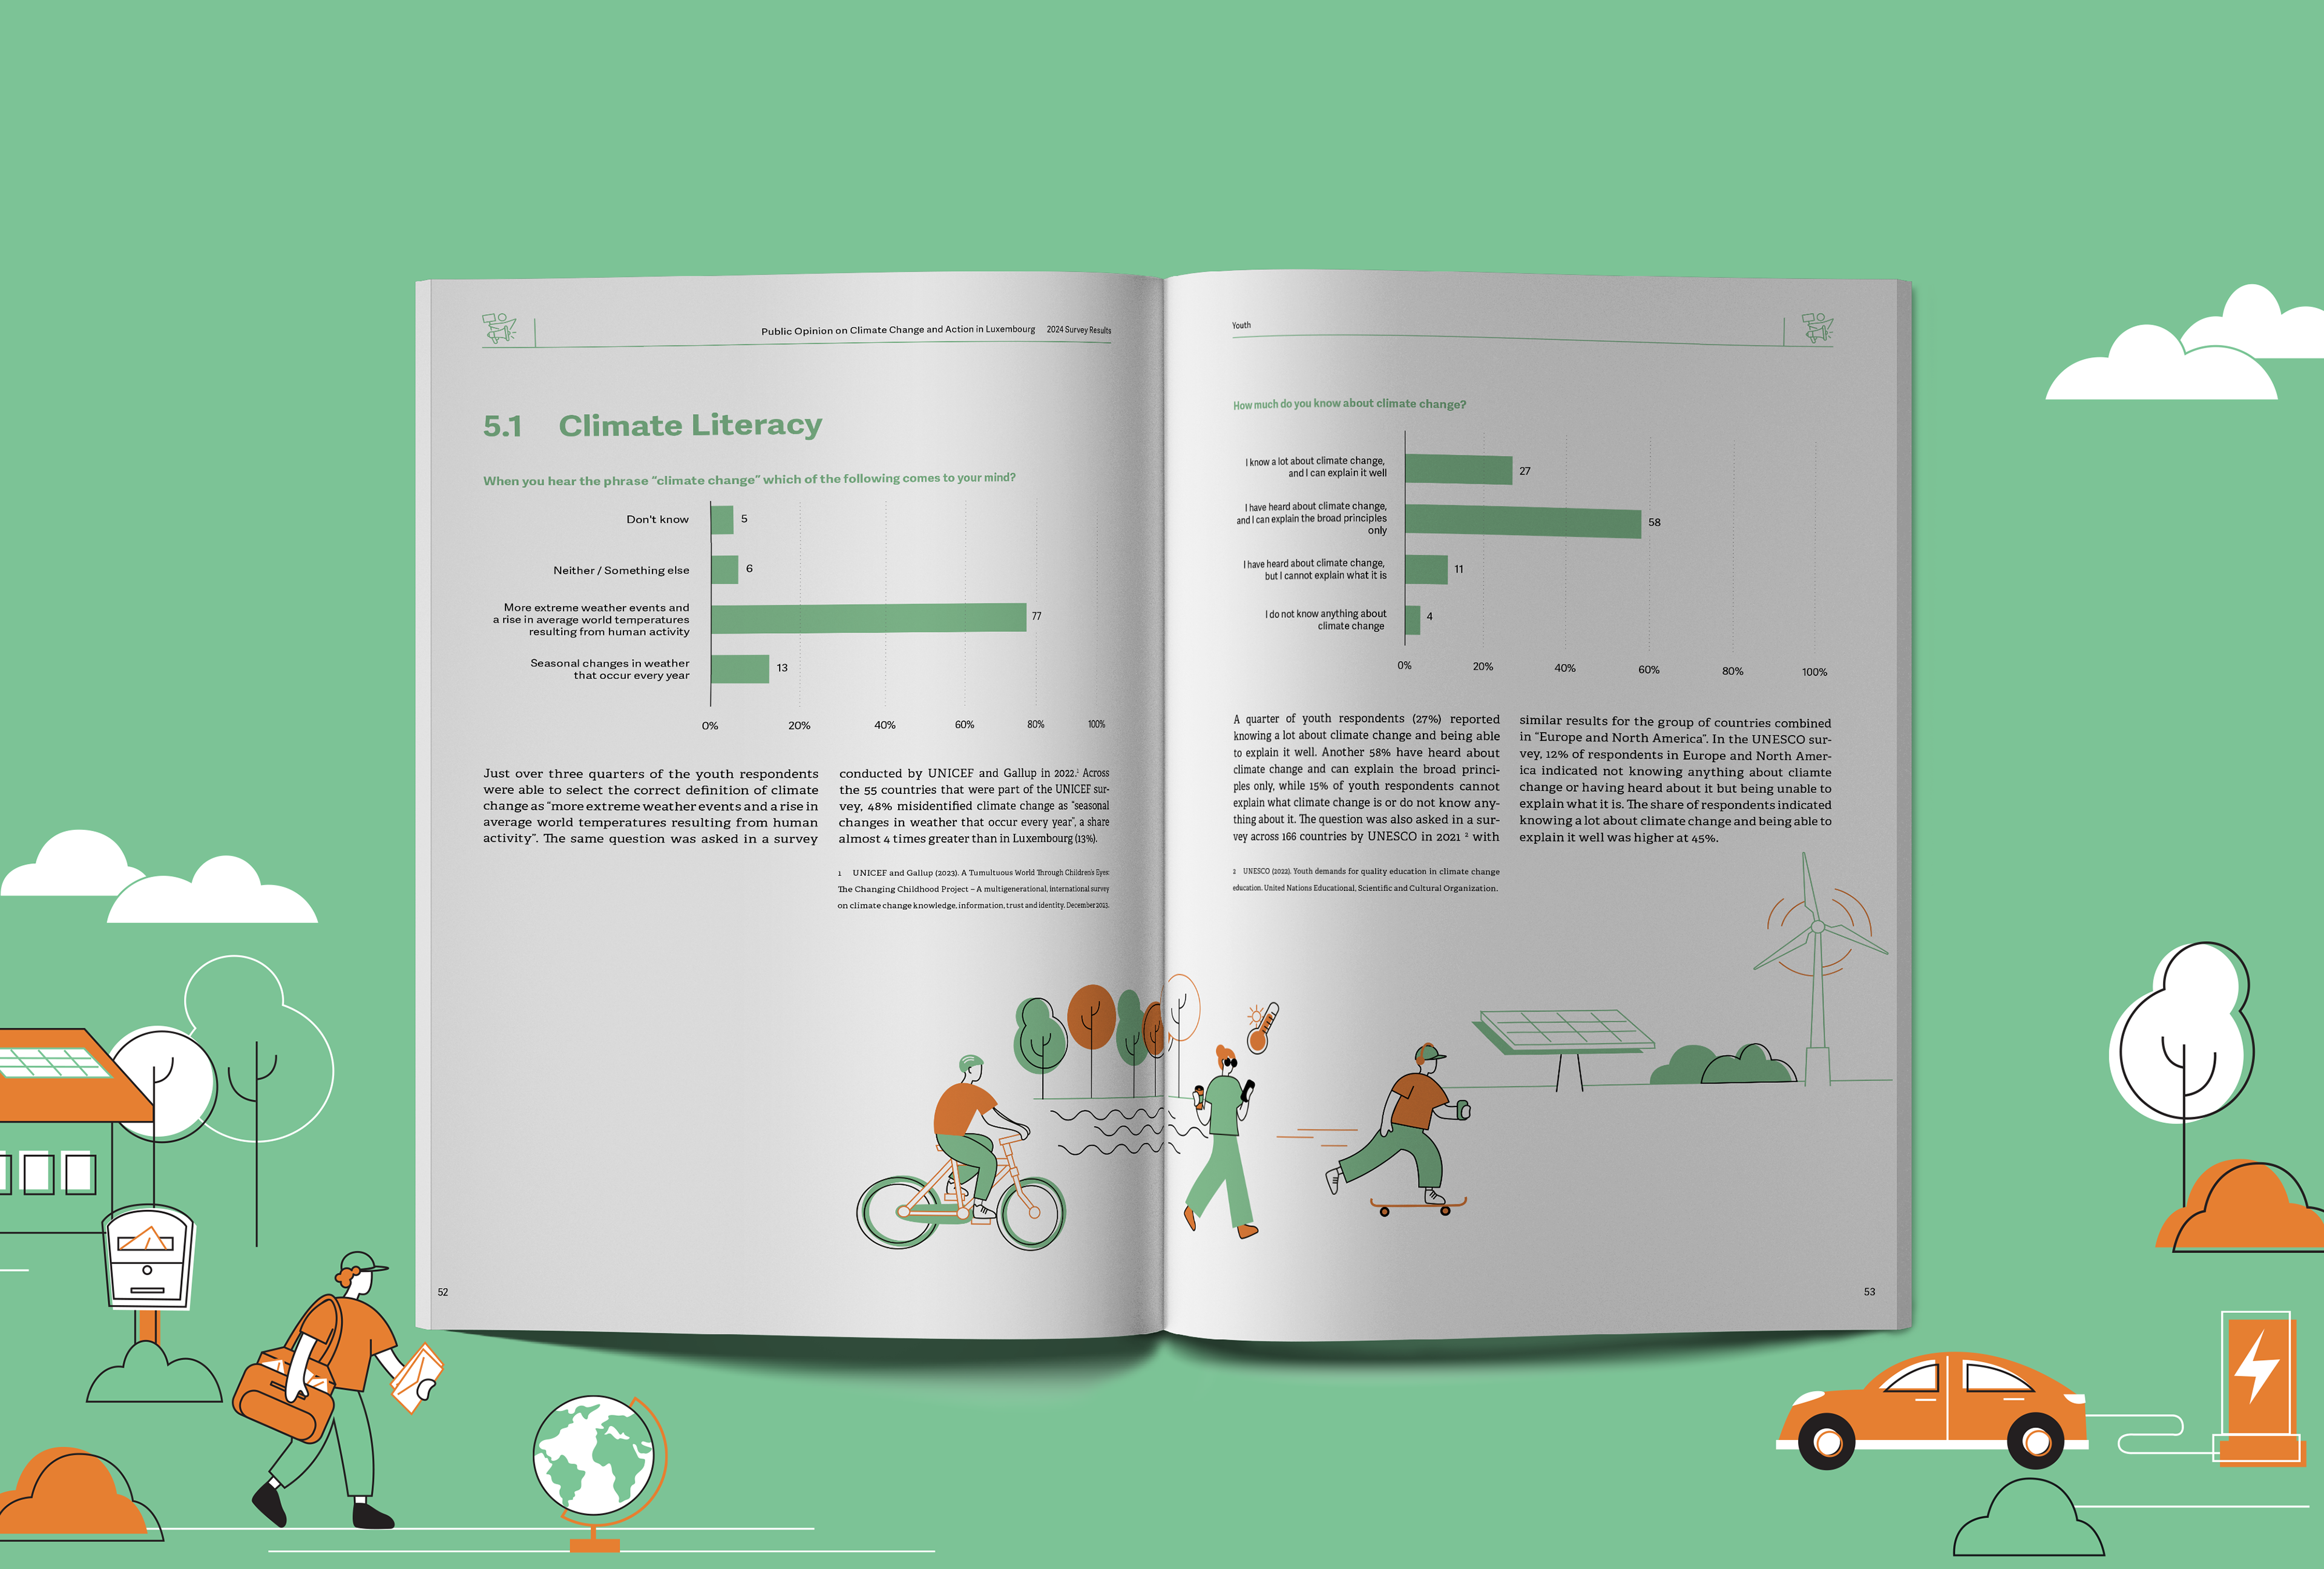
We recently designed a comprehensive report on climate change, turning data into a visually engaging experience.
To make the content more accessible, we integrated a wide range of diagrams, charts, and custom illustrations, helping readers quickly grasp key facts and trends.

Corporate Illustration and Layout

Datavizualisation Chartdesign


